
")
Building upon the previous discussion on the behaviour and design rationale of steel welded tapered beam-columns, this part of the article delves deeper into their structural performance under combined loading conditions. With a focus on experimental observations and analytical evaluation, it further examines how these members respond to simultaneous bending moments and axial compression, highlighting key behavioural patterns, failure mechanisms, and design considerations essential for practical applications in steel structures.
EXPERIMENTAL RESULTS
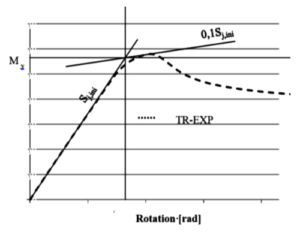
The results obtained from the experimental investigation were summarised in the form of tables and graphs. The results recorded during the tests, in terms of load (F) and displacements (d) were converted in terms of bending moment (M) and rotation (ϕ) and finally, the (M-ϕ) curve was built. The bending moment at the top of the column (left side of the specimen) was computed using the earlier first equation, whilst the rotation of the specimen at the front of the vertical element was computed using the below equation:
Where: Mred,EX is the reduced bending moment at the column top; F is the applied horizontal force; Lr is the lever arm of the applied force, distance between point of applied force and the intersection of neutral axis of vertical column and of tapered column (Lr = 1.85m); Lcn is the nominal length of the column (3.6 m); Lca is the actual length of the column (Lca = 3.41m).
Where: ϕ is the rotation of the specimen with respect to its initial position; D1 is the measured displacement; Lr is the lever arm of the applied force (Lr = 1.85m). The moment-rotation curves and failure modes, show the behaviour of the tapered columns.
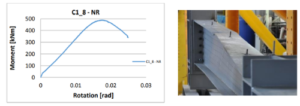
C1_8 Specimen behavior curve and failure mode
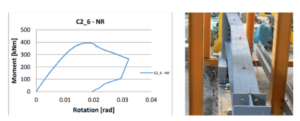
C2_6 Specimen behavior curve and failure mode.
In the Table are presented both the elastic (Fel) and ultimate (Fu) applied axial force, and corresponding bending moment (Mel and Mu), evaluated according to the procedure. The elastic capacity of the experimental specimen will be considered and compared with the design capacity of the members.
Experimental elastic and ultimate capacity
| Specimen | Fel [kN] | Fu [kN] | Mel [kNm] | Mu [kNm] |
| C1_8 | 273 | 279 | 478 | 488 |
| C2_6 | 214 | 225 | 375 | 395 |
| C3_8 | 253 | 261 | 443 | 457 |
| C4_6 | 215 | 221 | 376 | 388 |
| C5_8 | 298 | 309 | 521 | 541 |
| C6_6 | 266 | 277 | 466 | 485 |
ECCS procedure for the evaluation of Mel
Due to the slenderness of the cross-section walls, for all specimens, the failure mode is governed by buckling phenomenon which makes the ratio between elastic and ultimate capacity (s) to vary in the range of 1.02–1.05. This fact could be also underlined by small values of the cross-section local ductility (R), expressed as a ratio between the rotation corresponding to the elastic limit and the ultimate member rotation.
ANALYTICAL RESULTS
It is generally known that experimental tests are time, labour and money consuming. Even though, if the boundary conditions and the applied force are not provided properly, the final results of the experimental test could be significantly altered. The finite element modelling is a powerful tool as an alternative to the experimental tests for the analysis of behaviour and establishing the ultimate capacity of steel structural elements, but this approach is reserved for trained and skilled engineers.
Generally, methods that involve advanced numerical simulation are not preferred by design engineers. The European norm EN 1993-1-1 describes three different procedures to verify the stability of steel elements, including beam-columns (members under combined axial load and bending).
These approaches are: An imperfection approach, by incorporating in the structural second order analysis appropriate equivalent geometric imperfections to cover the possible effects of all types of imperfections, like residual stresses and shape imperfections such as lack of verticality, lack of straightness, lack of flatness, lack of fit and the unavoidable minor eccentricities present in the joints of the unloaded structure.
EN 1993-1-1 provide rules for introducing global imperfections of frames and bracing systems and local imperfections of individual members. Also, as an alternative, the shape of the relevant elastic critical buckling mode of the structure, usually the first mode, may be applied as a unique global and local imperfection.
This approach is not widely used in current design practice, but it becomes useful when advanced finite element simulations are required.
The most comprehensive approach is the so-called “general method”. The method no longer isolates members and separates the pure buckling modes, but considers the complex system of forces in the member and evaluates the appropriate compound buckling modes.
One of the advantages of the general method is that it can examine irregular structural members such as tapered members and built-up members. Although in the current version of the Eurocode, the general method is recommended only for lateral and lateral-torsional buckling of structural components, the basic approach may be extended to other cases.
Many research projects are underway across Europe, intended to verify and widen its applicability. For determining the buckling resistance of elements with non-uniform sections along the member the European norm recommends a second-order analysis, accounting for imperfections or applying the general method, described in following paragraphs.
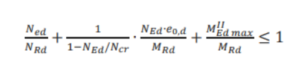
Overall resistance to out-of-plane buckling can be verified assuring that: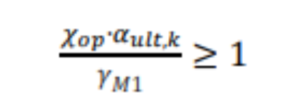
Where: αult.k is the minimum load amplifier of the design loads to reach the characteristic resistance of the most critical cross-sections of the structural component, considering its in-plane behaviour without taking lateral or lateral torsional buckling into account, however, accounting for all effects due to in-plane geometrical imperfections, global and local, where relevant; αcr,op is the minimum load amplifier for the in-plane design loads to reach the elastic critical resistance of the structural component with regard to lateral or lateral torsional buckling without accounting for in-plane flexural buckling. χop is the reduction factor for non-dimensional slenderness to take account of lateral and lateral-torsional buckling. The reduction factor χ may be determined from either of the following methods: the minimum (the recommended option) or an interpolated value between the values χ and χLT.
As one can notice, the general method involves advanced numerical tools and stability knowledge being very difficult to use in case of practical design application.
The last procedure deals with isolated members and is the conventional engineering solution for buckling problems, but its explicit code provisions are limited to uniform members with simple support and loading conditions. This method makes two simplifications considering the member isolated from the structure applying boundary conditions (supports, restraints or loads) and the buckling of the member is determinate separately for the pure buckling modes (i.e. flexural buckling for pure compression and lateral-torsional buckling for pure bending) and combined by applying interaction factors.
The article follows an analytical design procedure dealing with the stability of non-prismatic members. The obtained analytic results will be compared with the experimental ones. The method is based on simple interaction formulas.
Design steps for isolated member approach.
| Step | In the most stressed section | Isolated member |
| 1 | Calculate the design values of the compressive force and bending moment on the member | Ned
My,Rd |
| 2 | Calculate the compression and bending resistances of the cross section according with the cross section class | Nc,Rk
Mc,Rk |
| 3 | Calculate the pure elastic critical compressive force according to minor axis flexural buckling Ncr and the pure elastic critical bending moment of the member Mcr | Ncr
Mcr |
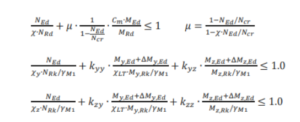
| 4 | Calculate the member slenderness and reduction factors separately for pure minor axis flexural buckling and pure lateraltorsional buckling (λ, χ, λLT and χLT) | 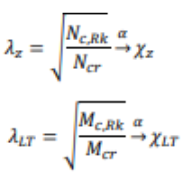 |
| 5 | Calculate the interaction factors connecting the two pure buckling cases (Annex A or Annex B) | Kzy |
| 6 | Calculate the design buckling resistance of the member and check the member combination of axial load and bending | 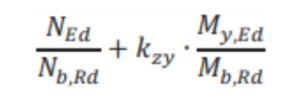 |
The elastic critical moment for lateral torsional buckling Mcr was computed, according to the method described considering an equivalent height of the element, and it was also confirmed by finite element simulations, i.e. buckling analysis on individual isolated members.
Generally, for critical moment computation, the wrapping of the section (kw) and also the end rotation on plan (kz) are considered free. In general, this default consideration can conduct at significant underestimation of the members’ capacity. Making a more accurate estimation, according to the equation for this type of end connection, both degrees of freedom can be restrained, leading to a safety factor of the element closer to the one obtained by experimental tests.
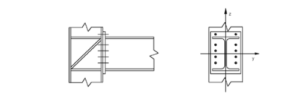
Extended end plate connection (kz = kw = 0.5) [13]
To determine the real utilisation ratio of the elements, the real mechanical properties have been considered, together with the nominal value of the yielding limit. Also, a comparison between the different effective length factors kz and kw that depend on the support condition was done. The results are presented in the table. The design values for NEd and MEd introduced in the interaction formula verification are the capacities determined experimentally. The resulting ratio is, in fact, the underestimation ratio of the analytical calculation related to the trustful experimental results.
Analytical results
| End support condition | kz=kw=0.5 | kz=kw=1 | |
| Material properties |
Determined |
Nominal |
|
| Specimen |
Ratio* |
||
| C1_8 | 1.13 | 1.38 | 1.54 |
| C2_6 | 0.94 | 1.15 | 1.28 |
| C3_8 | 1.36 | 1.29 | 2.04 |
| C4_6 | 1.24 | 1.18 | 1.85 |
| C5_8 | 1.38 | 1.31 | 1.97 |
| C6_6 | 1.32 | 1.25 | 1.87 |
* the ratio between the experimental and analytical capacity
Despite using more appropriate end-condition, leading to closer values for members’ capacity, the analytical prediction gives up to 38 per cent higher values. These differences could be explained by the members’ overstrength due to the amount of strain-hardening, defined as the non-dimensional measure of the ultimate capacity of steel members. Empirical formulation, described and discussed by means of artificial neural network formulation, predicting the rotation capacity (R) and the flexural overstrength (s) could be found in the literature.
Using a wide database of experimental results, D’Aniello et al. proposed an empirical equation to predict the flexural overstrength factor. In our case, involving class 3-4 cross-sections, the overstrength factor takes values around 0.76 similar with the buckling reduction factors.
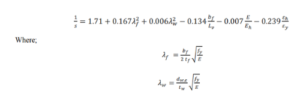
Are the flange and the web slenderness parameters, respectively, with bf being the flange width, tf the flange thickness, dw,e the compressed part of the web, and tw the web thickness; Lv being the shear length, i.e., the distance between the plastic hinge and the point of zero bending moment.
CONCLUSION
Following the results showed in the table, one may notice an important difference between the analytical results and experimental ones in case of free end support condition, i.e. kz=kw=1. Even if these are the default values recommended being used in practical design, a careful analysis of the connection details could lead to a more rational design.
The scatter in the material properties could lead to a non-conservative situation. For example, in case of C1_8 and C2_6, the flanges were manufactured using an inferior steel grade, probably S275, a situation in which a limit design process will overestimate the real element capacity.
Even if the use of restrained end condition for warping and rotation about weak axis z (kz=kw=0.5), has proven to give more accurate results, in case of inconsistencies, which often appear in practice, some situations may lead to unsafe design.
Contributed by:
A.I. Dogariu, Politehnica University of Timisoara, Romania


